In this lab, we began by downloading tutorials for reference-based assembly and for de novo assembly. Once downloaded, files were imported into Geneious.
The reference-based assembly worked with a dataset of Illumina sequence reads that map to a single gene in the E. coli genome. The first step was trimming the data according to the default settings. Next, trimmed reads and the reference sequence (yghJ CDS) were assembled via mapping to reference. Following the assembly, a contig of the reads mapped to the reference and an assembly report were generated. High and low coverage of the reference sequence and the consensus sequence. The next step was detecting SNPs in the mapped data using the Find Variations/SNPs under the Annotate/Predict menu. An annotation track was added to the reference sequence following this step. Additionally, a table of all the annotations on the sequence was generated, which included polymorphism annotations. Finally, SNPs were filtered based on their overlap with another annotation track or annotation type. Specifically, SNPs that were present in regions of low coverage were filtered out. Below are responses to questions regarding the reference-based assembly tutorial.
- Five reads that had their ends trimmed due to low quality bases included: #10 (185658/2), #11 (55687/1), #18 (191505/2), #23 (135909), #53 (190007/2).
- I think paired-end reads are more important to use for de novo assembly because reference-based assembly entails utilizing already sequenced genomes as a reference for mapping the location of reads. In other words, the reads are aligned to the reference sequence. With de novo assembly, there is no prior sequence knowledge, thus paired-end reads can provide information about the sequence on each end.
- It was a relatively quick process for the reads to map to the reference genome. According to the yghJ paired Illumina reads assembled to yghJ CDS (divergence reference) Report, it took about 7.02 seconds.
- When the yghJ CDS (divergent reference) sequence was assembled to the yghJ paired Illumina reads, 5,058 of 5,060 reads were assembled. In addition, there was a coverage of about 4, 581 bases, with an average coverage of about 98.1 bases. This assembly yielded a maximum coverage of about 139 and a minimum of 1. The following intervals of the assembly contained the lowest coverage: 1 – 43, 121 – 173, 294 – 310, 4303, 4338 – 4401, 4435, 4499 – 4581. These intervals were located either at the beginning or at the end of the consensus sequence. Thus, they might have been insufficient reads to accurately identify the bases at these ends.
- When the consensus sequence changed between using a “100% Identical” and “Highest Quality” consensus, the four following sites changed: #20 (R à A), #38 (M à C), #84 (W à T), #127 (R à G). In terms of polymorphism, these sites reveal that there are two possibilities of bases that can be present in the reads. As a result, this can lead to large variety.
- One region in the sequence that had >2 standard deviations below that mean in coverage was 4467 – 4483. We would not want to classify this region as a SNP because there was too much variation in this region. With SNPs, we are only looking for a site where there is a base difference. In this region, however, it is possible an incorrect fragment was added, although there was a single base pair difference.
- Two CDS positions where there was a transition mutation include CDS position 4,575 (A to G) and CDS position 4,464 (A to G). Two sites where there was a transversion mutation includes CDS position 4,485 (G to T) and CDS position 3, 614 (C to A). For the latter transversion mutation, there was an effect on the protein. The former transversion mutation had no effect on the protein.
- Below is a screenshot of the polymorphism table.
9. One region of low coverage that was excluded using the “Compare Annotations” tool in Geneious that did not result in excluding SNPs was region 4,499 – 4,581. In this region, 12 SNPs were not excluded. One region where SNPs were excluded included 4,438 – 4,581. 10. Below is a screenshot of the annotated reference genome with SNP calls.
The de novo assembly tutorial utilized short read next-generation sequencing data to perform a de novo assembly of a section of the Staphylococcus aureus genome. First, the reads were assembled using de novo assembly. An assembly with 4 contigs was produced. To see how the contigs align to the original sequence, sequences were assembled using Map to Reference under the Align/Assemble menu. In the region around 90,000, there was no reconstructed contig, which is why the two longest contigs could not be joined. Next, two sets of reads were combined into a single paired reads file. Once the paired reads file was created, De Novo Assemble was selected from the Align/Assemble menu. The resulting consensus sequence was mapped to the NC_009487 reference sequence. A final contig was generated that was almost full in length with a few positions that were ambiguous due to errors in the original data. The bases were corrected using the Find Variants/SNPs under the Annotate and Predict menu. Ambiguous bases in the consensus sequence such as “R” were changed according to a “0% – Majority” threshold. The final step in the tutorial was remapping the new consensus sequence to the NC_009487 sequence.
- From the assembly, 25, 172 reads were assembled along with 4 contigs that were produced. The largest contig (contig 1) was assembled using 17, 994 reads. The minimum length of the shortest contig (contig 4) that was assembled from 42 reads was 512 bp long. The means of length of contigs >1000bp was 133, 444 bp. Finally, the yhe NC50 score for this assembly was 1.
- The de novo assembly took about 17.06 seconds, slightly longer than the reference-based assembly. Contig 4 had the lowest maximum coverage and contig 1 had the highest maximum coverage.
- The region of that had no coverage was 90,759 – 92,269. This region was where the longest contigs could not be joined.
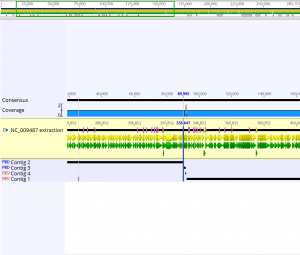
- The de novo assembly with paired data took about 5.61 seconds; this assembly took less time than the two previous assemblies.
- Correcting the Paired Reads Assembly sequence was necessary because it contained ambiguous bases. These regions might have been the product of poor assembly or read errors. By correcting the bases in the consensus sequence, we can ensure there is consensus between the sequences and the consensus sequence. Also, it ensures that the consensus sequence contains the most common base relative to the other sequence.
- The final assembly sequence that was constructed using the pair reads sequence and the NC_009487 extraction sequence was 285,156 bp long. Below is a screenshot of the final consensus sequence that was generated.
The second part of the lab entailed scoring the ISSR gels for each primer (Omar and 17898) for banding – a “1” if a band was present and a “0” if a band was not present. After the bands were scored, results were transferred into an Excel spreadsheet. Next, a nexus data file was formatted using the “ISSR_data_format_example” as a template. The matrix was pasted into the data file, “taxa labels” were added that corresponded to the names of the individuals, and the nchar was set to 11 to account for the total number of bands scored. Because not all classmates chose the same three individuals to use for both primers, two nexus files were generated, one for each marker. Below is a screenshot of each nexus file.
Nexus file for 17898 primer:
Nexus file for Omar primer:


