October 11, 2018
During this lab session, Geneious was used to infer phylogeny trees for the 25 species of Actinopterygii that were chosen from the NCBI nucleotide database in comparison to the three sequenced nucleotide samples from the previous labs. Putting these together in one folder, a multiple alignment of all 28 sequences was created. Then, for better comparison between sequences, nucleotides tides were deleted from the beginnings and ends of the sequences to ensure equivalency in segment lengths using the shortest sequence as a basis for deletion. Six sequences did not fully match the homologous nucleotide sites of the others, so it was presumed that the misalignment may have been due to the sequences being the reverse complements. However, even after reversing the sequences and once again comparing all of the strands together, this misalignment was not solved. So, the sequences that did not align were removed from the overall alignment (though a different six sequences that matched the others were added later for the long-run analysis), which resulted in a end total of 22 sequences within that multiple alignment.
The next step was to install the jModelTest2 program in order to choose the best model of molecular evolution. Once the program was installed, the multiple alignment was exported in a Relaxed Phylip format and opened in the jModelTest program. The jModelTest then ran AIC and BIC analyses to generate likelihood scores for 88 models of molecular evolution to find the best model for the particular data set. Results from AIC analysis during the initial run of the experiment portrayed the best model to be TPM2UF + I + G, which did not correspond to the best model determined by BIC. BIC analysis showed HKY + G to be the best model of molecular evolution.
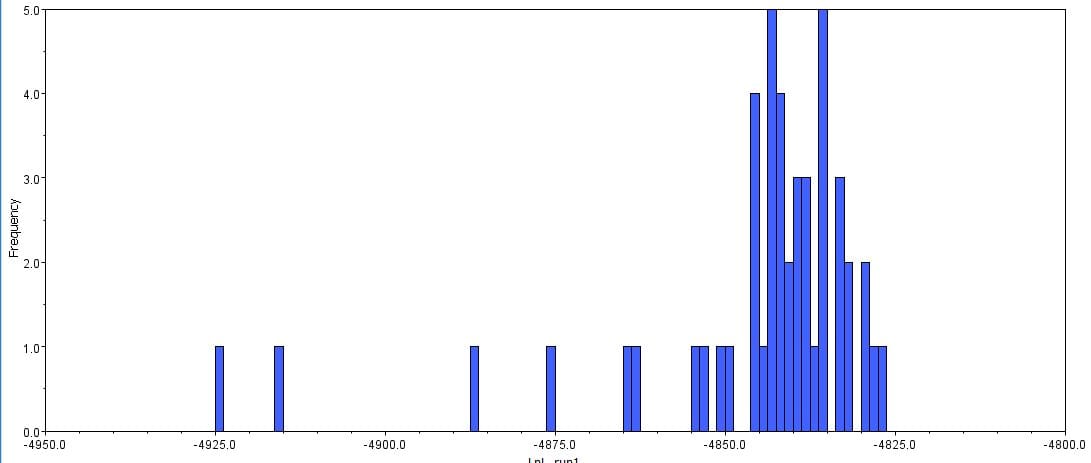
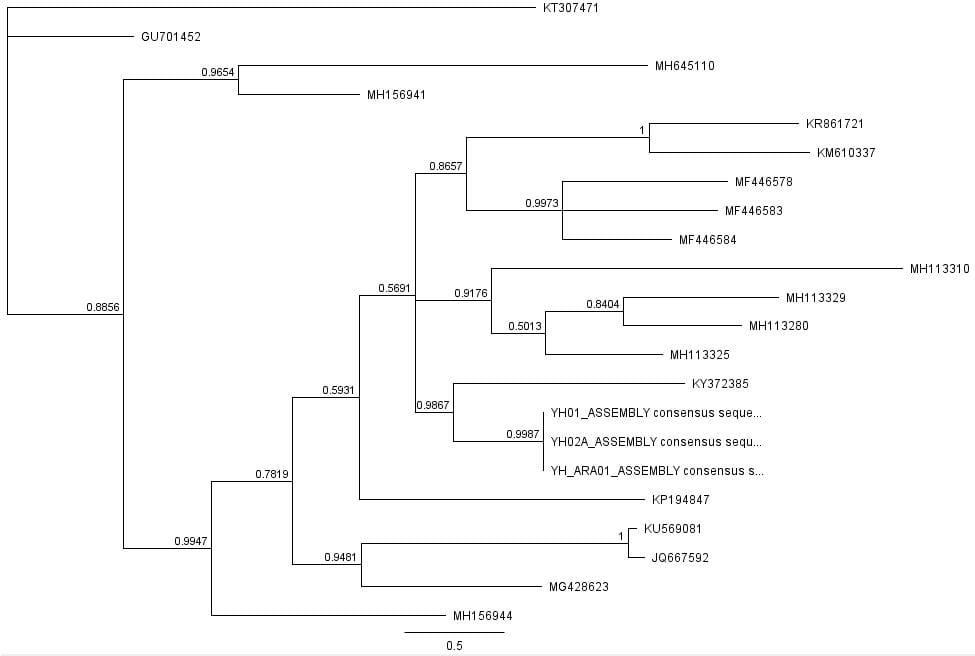
Afterwards, several hypothetical phylogeny trees were constructed based on results from Bayesian inference, maximum likelihood, and PHYML. Using the parameters outlined by the jModelTest2 and Bayesian inference, a short-run analysis was performed. The resulting posterior output graph did not have much of a shape or bars in general.
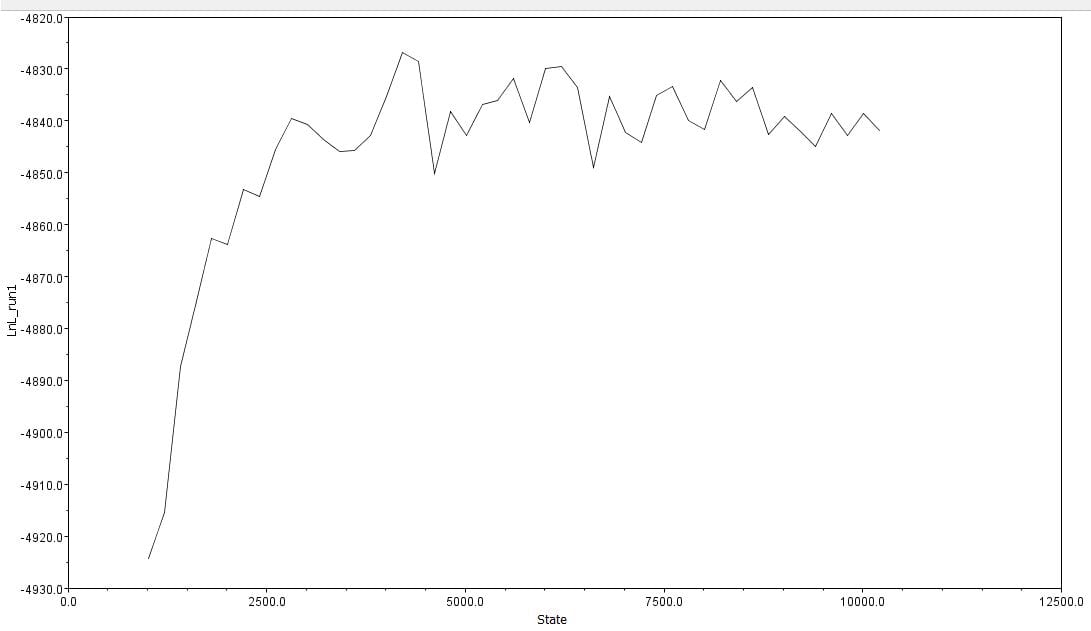
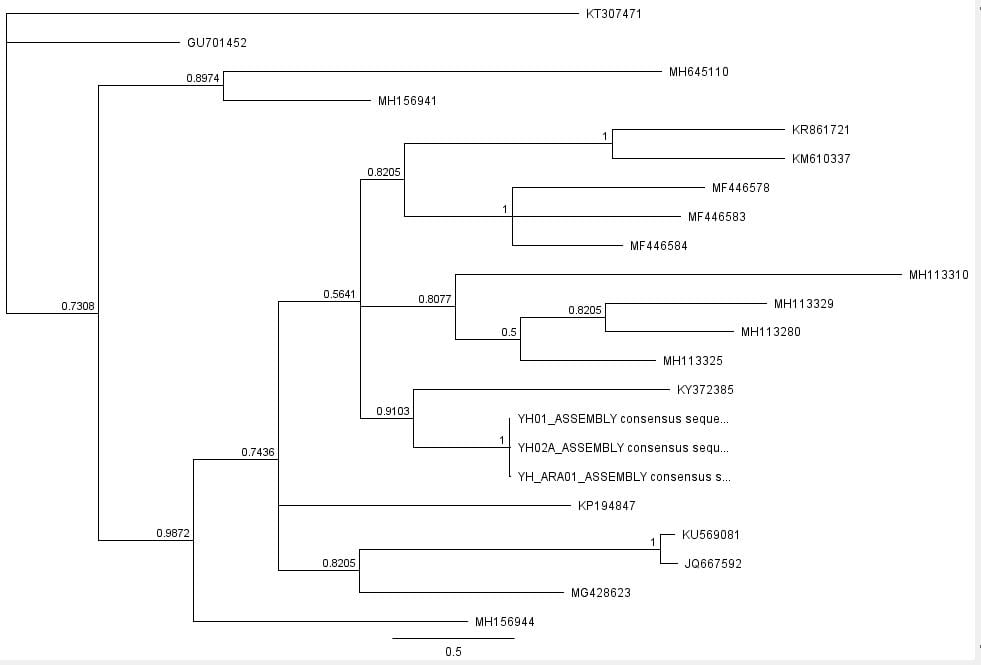
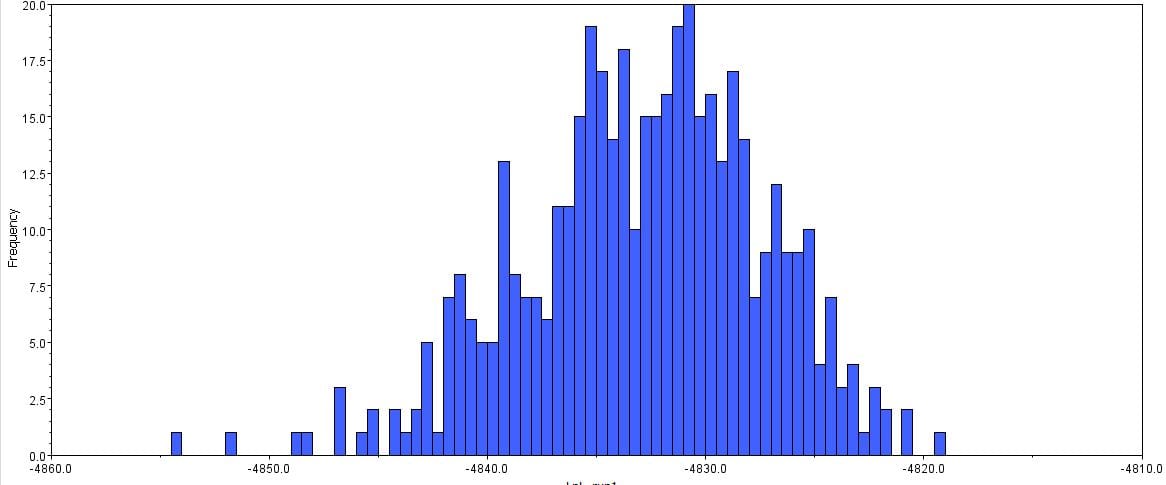
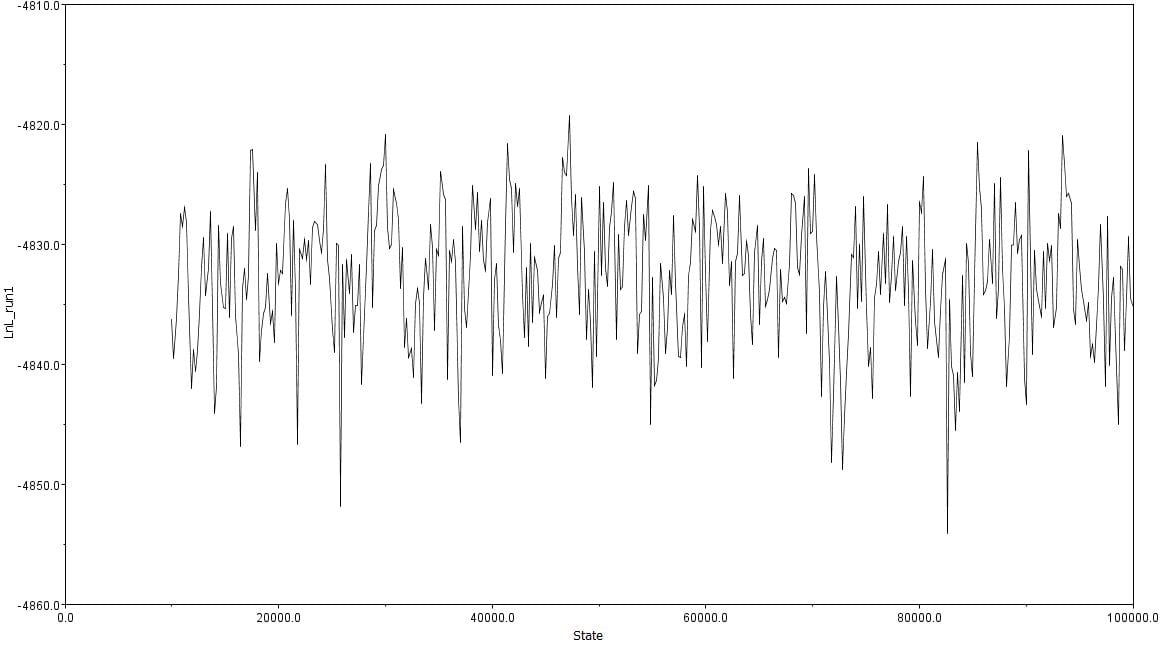
A second, longer run of the Bayesian inference using the same data was performed. The graphs obtained for this longer-run analysis showed a better distribution in terms of the bar graph shape and number of values. The predicted tree outcomes were very similar in terms of clades, but varied slightly in regards to the length of branches for specific sister taxas.
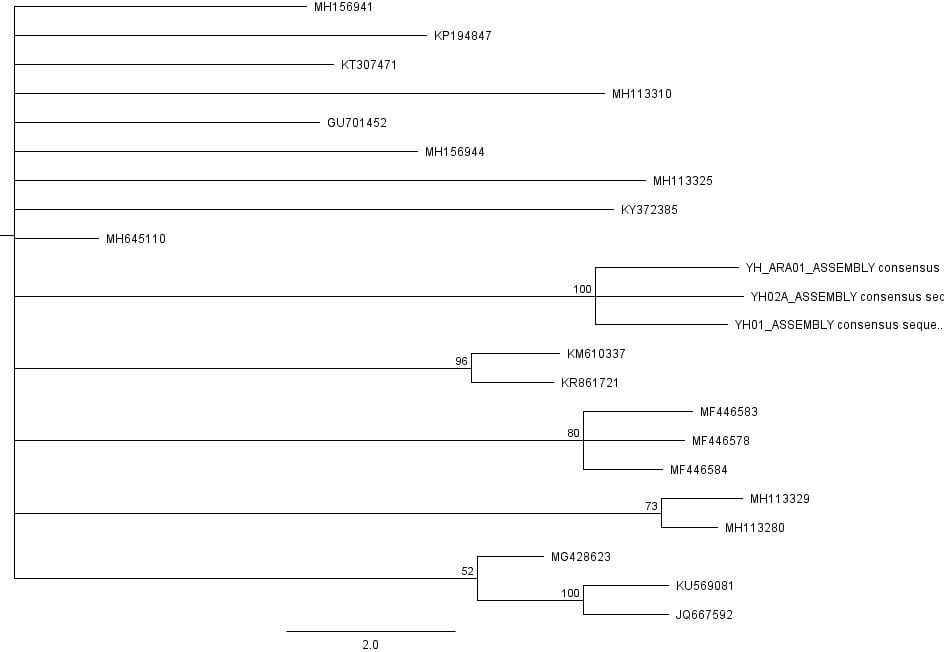
A maximum likelihood inference of a phylogenetic tree was also generated using the RAxML plugin on Geneious. Following the parameters of the evolutionary models determined by jModelTest 2 and choosing ‘Rapid bootstrap with rapid hill climbing’ , 100 trees were generated within one document. A consensus tree was then built out of these bootstrapping trees. However, the tree obtained was significantly different compared to the first analysis run with Bayesian inference since not only were many of the clades different, but the predicted max likelihood tree showed a significant amount of polytomy.
Finally, the last method tested used PHYML, but with the HKY85 model of molecular evolution and the final Bayesian tree. However, despite running PHYML multiple times, the plugin seemed to have difficulty running and stays at 0% for over 15 minutes. Therefore, I was unable to obtain conclusive data using this particular method of computing maximum likelihood.