Module 2: Write Out

Hello, everyone, my name is Qiqi. Before I started my presentation today, I would like everyone to look at the screen and think about this question: Is the Panhandle safe for everyone? If your answer is a “YES”, then I will tell you why it’s not, by showing some evidence I collected.
The Panhandle is one of the most popular places for people to hang out in San Francisco. There are many activities involved in this park. People go walking, jogging, skateboarding, cycling, etc. And of course, it’s a place for kids and small pets too. All different types of activities made this place so lively and therefore it has a path separated from vehicles. Now, let’s look at what this path looks like. I’m sure you guys are familiar with it:
For those of you who don’t know, the path here is a Class I Multi-Use Path, which provides a completely separated right of way for the exclusive use of bicycles and pedestrians with cross-flow minimized. And in fact, as you can see, there are some dashed lines in the middle of the path. It’s used to separate bicycles and pedestrians. But what can we learn from the picture here?

Look at the poor girl in the yellow circle. She’s surrounded by all the bicycles. The path is supposed to be divided for both pedestrians and bikes, but now the cyclists take up both paths. Not to mention how fast they ride.
To figure out the speeds of different path users, my colleague Malia and I collected some data when we were at the Panhandle. We record how many seconds each activity takes in a 50-feet distance. Here is our result:

Now, you guys might feel overwhelmed and think: Okay, we saw the results, but what do all these boring numbers mean?
Well, we all know that the numbers themselves mean nothing. We make them meaningful by applying them into the context we want to convey to our audience. Therefore, I learn some tricks from “How to Lie with Statistics” and made a chart.
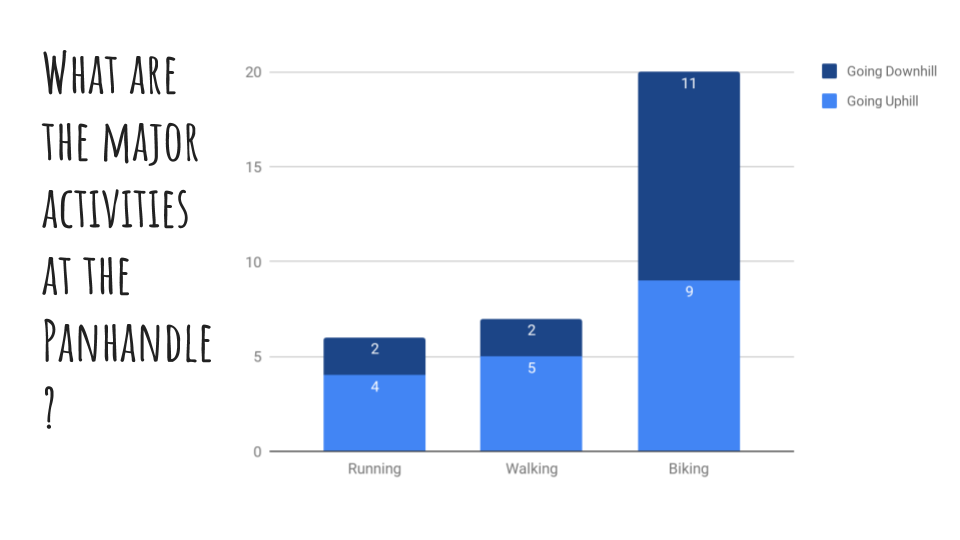
Now that means something, isn’t it? We can see that the top activity at the Panhandle is biking. But instead of classifying activities, I want to show you guys who are the major user of the Panhandle, so I made another pie chart to visualize it.
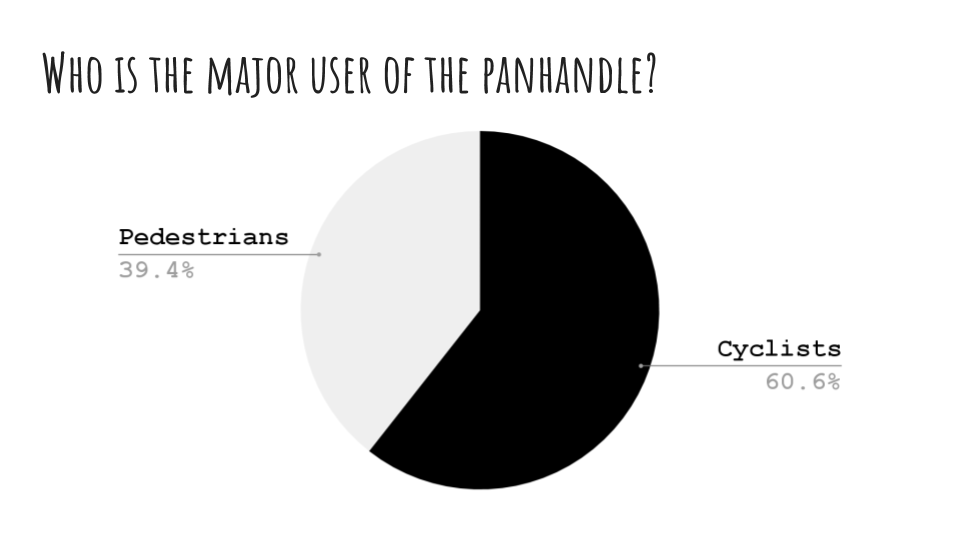
From the chart here we learned that cyclists take up to sixty percent of all the users. Now let’s go back to the result and calculate the speed of the slowest cyclists and pedestrians.

The slowest speed of the pedestrians is 3.33 ft/s and the slowest speed of the cyclists is 8.8 ft/s. What that means, is that the speed of the slowest cyclist is 164% more than the speed of the slowest pedestrian.

Don’t you think they are riding way too fast?

Look at the girl here, don’t you feel like she’s in danger?
The Panhandle is a place for everyone, but it doesn’t seem so safe for everyone. In order to make the environment more safer, recently, they added a painted sign to remind the cyclists “XING, SLOW”.

But that’s only a “technical solution”. To really solve the problem, it also requires everyone’s moral change. Only when people consider each other’s feelings and safety, then we can make the Panhandle a safer park for everyone. 

![]()