On Tuesday, 09/17/2019 at 02:15 PM, we filled the gel electrophoresis lane table for each of our samples, I decided to place my samples with ID numbers EO 1, EO2, EO3 and EO4 to 5th, 6th 7th and 8th lanes respectively from left to right. Then, we started to undergo the procedure for the Electrophoresis of PCR products. I got my PCR tubes and thawed them. I pipetted 3ul of my PCR products into its own dye dot on a sheet of parafilm. I loaded 5ul of my dots into the gel. We ran the gel at 130 volts for 30 minutes. After that, we moved to the clean-up procedure of PCR products for sequencing known as ExoSap. I carefully labeled new 0.2 ul PCR tubes with each of my sample codes. We determined the number of PCR clean-ups as 18. We calculated that we needed 191 ul of H20, 22.5 ul of 10x buffer, 7.9 ul of SAP and 4 ul of Exo. I put my reagents on ice and pipetted 7.5 ul of each of my PCR products into a clean, labeled 0.2 ul PCR tube. We made the ExoSap master mix and kept the reagents on ice while it is made. I pipetted 12.5 ul into each PCR product tube and placed my tubes in a thermocycler and then Prof. Paul started the EXOSAP program.
Monthly Archives: September 2019
Mount Tamalpais Trip
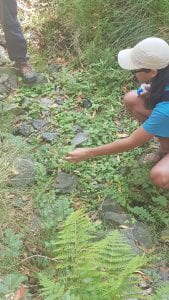
On Tuesday 09/10/2019, we took a car ride to Mount Tamalpais Rock Spring (37,9106721, -122,6129603). This public land contains 40 endemic plants and it is administered by different entities. The main goal of this trip was to get the full spectrum of what ecologists does. We walked down through rock spring and followed a creek to find and collect samples of Mimulus guttatus.
On our way, we encountered a poison oak. We had to avoid any contact with this plant because it causes irritation on skin.
We stopped at a shady spot where we saw groups of Mimulus guttatus growing. Alec, a graduate student doing research in this area, gave us a brief background on his research. He told us that he is studying time and variability hypothesis by comparing inland and coastal populations of Mimulus guttatus and that the shady part of the land is a good place to study this topic because there is not much temperature fluctuations. He also added that this species has a lot of morphological diversity which made allowed them to survive in different habitats. Moreover, these properties of Mimulus guttatus allowed it to be the second most studied plant species in ecology.
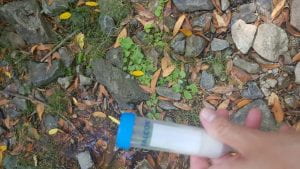
After the briefing, we collected fresh plant leave samples, placed them in tubes with silica gel and labeled them by date and our initials.
After that, we moved to a drier environment and found a dead population of Mimulus guttatus with a different morphology than the ones inside the creek.
Next, we took short ride to a serpentine habitat which is a harsh place to live for plants due to heavy metals inside the soil. We were able to find another dead population of the species.
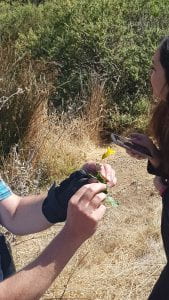
Finally, we walked through a hillside where we observed a blossomed Mimulus guttatus. Here, we argued that the habitat influences whether the plant are annual or perennial.
Lab 2: The Sushi Test
On Monday, 09/02/2019 at 18:37, I’ve bought a frozen Coho Salmon fillet and a Wild Ahi Tuna steak from Lucky Supermarket at 1750 Fulton Street. Later, at 19:03, I’ve a bought Pacific Yellowtail sashimi and Long Fin Tuna sashimi from SQwers Japanese Restaurant. I’ve kept the samples at the fridge over the night.
On Tuesday, at 14:00, I’ve started the lab work of extracting DNA from animal tissues. First, I recorded the information about my samples on the Animal Tissue DNA Extraction data sheet. I gave my Coho Salmon sample the ID code “EO-1”, Pacific Yellowtail sample “EO-2”, Long Fin Tuna “EO-3” and Ahi Tuna “EO-4”. Then, I’ve put on gloves and labeled 4 locking rid micro centrifuge tubes both on the top and side for each of my samples with the unique ID codes. I took my samples to free table to cut out a small piece out of them using a scalpel and a tweezer. I wiped my equipment with ethanol after handling each sample. I weighted all my samples and they were in the range of 2-10 mg. I added l00 micro liters of Extraction Solution to each of my labeled sample tubes using a p200 micro liter micropipette and unfiltered tips. Later, I added 25 micro liters of Tissue Preparation Solution to the micro centrifuge tubes with the 100 micro liter of Extraction Solution and I pipetted up and down gently to mix using a p200 micro liter micropipette and unfiltered tips. Next, I added each sample to its corresponding extraction micro centrifuge tube using forceps. I took a disposable non-filtered pipette tip and used it to gently mash my tissue samples up a bit. For each sample, I used a different tip. After that, I incubated the sample at room temperature for 10 minutes. During the incubation, I put the excessive fish samples back into the tubes and placed them on Prof. Paul’s desk. I moved my samples to the heat block. Incubate the sample at 95C for 3 minutes. At the end of 3 minutes, I took the sample out of the heat block, added 100 micro liters of Neutralizing Solution by using a p200 micro liter micropipette and filtered tips and mixed by vortexing. I changed the tip after each pipetting. Finally, I put my samples on ice.
I’ve started the second phase of the lab work, that is the amplification of CO1 from fish. First of all, I’ve labeled 4 centrifuge tubes with 1:10, name of my samples and my initials, both on the top and on the sides of the tube. Then, I added 18 micro liters of purified water to each tube. I added 2 micro liters of my gDNA samples to their corresponding tubes. After that, I gently flicked the tubes with my finger to mix the solutions. I let my lab partners to prepare the master mix using 102.4 micro liters of water, 160 micro liters of REDExtract-N-Amp PCR rx mix, 12.8 micro liters of forward primers and 12.8 micro liters of reverse primers. Next, I wrote the labels of my gDNA samples on my PCR tubes on the top and on the side just below the lid. I added 2 micro liters of 1:10 dilution of my gDNA to each of my PCR tubes. I changed tips between samples. While I was pipetting 18 micro liters of the master mix into my PCR tubes, I noticed that the master mix was almost empty, which points out that either there was a miscalculation of the amount we needed or some of my lab partners pipetted excessive amounts of master mix into their tubes. I obtained a clear master mix from another table and added 18 micro liters into my remaining tubes, that are, EO-3 and EO-4. I changed tips between samples. Finally, I left my PCR tubes on ice next to the thermocycler and then we placed the tubes in the thermocycler and started the reaction.
Hello world!
Welcome to your brand new blog at University of San Francisco Sites.
To get started, simply log in, edit or delete this post and check out all the other options available to you.
For assistance, visit our comprehensive support site, check out our Edublogs User Guide guide or stop by The Edublogs Forums to chat with other edubloggers.
You can also subscribe to our brilliant free publication, The Edublogger, which is jammed with helpful tips, ideas and more.


