Lab Entry 13 – Genomics
For this lab, analysis was done of the lupin plant DNA collected and utilized in previous posts. To run analysis, first a tutorial was completed in Geneious on reference-based assembly and de novo assembly. This was performed with sample sequences developled by Geneious and downloaded from the online website and installed into the Geneious program. A questionnaire was completed along with taking screen shots of the final results from the tutorials of both reference-based and de novo assemblies.
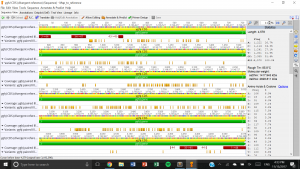
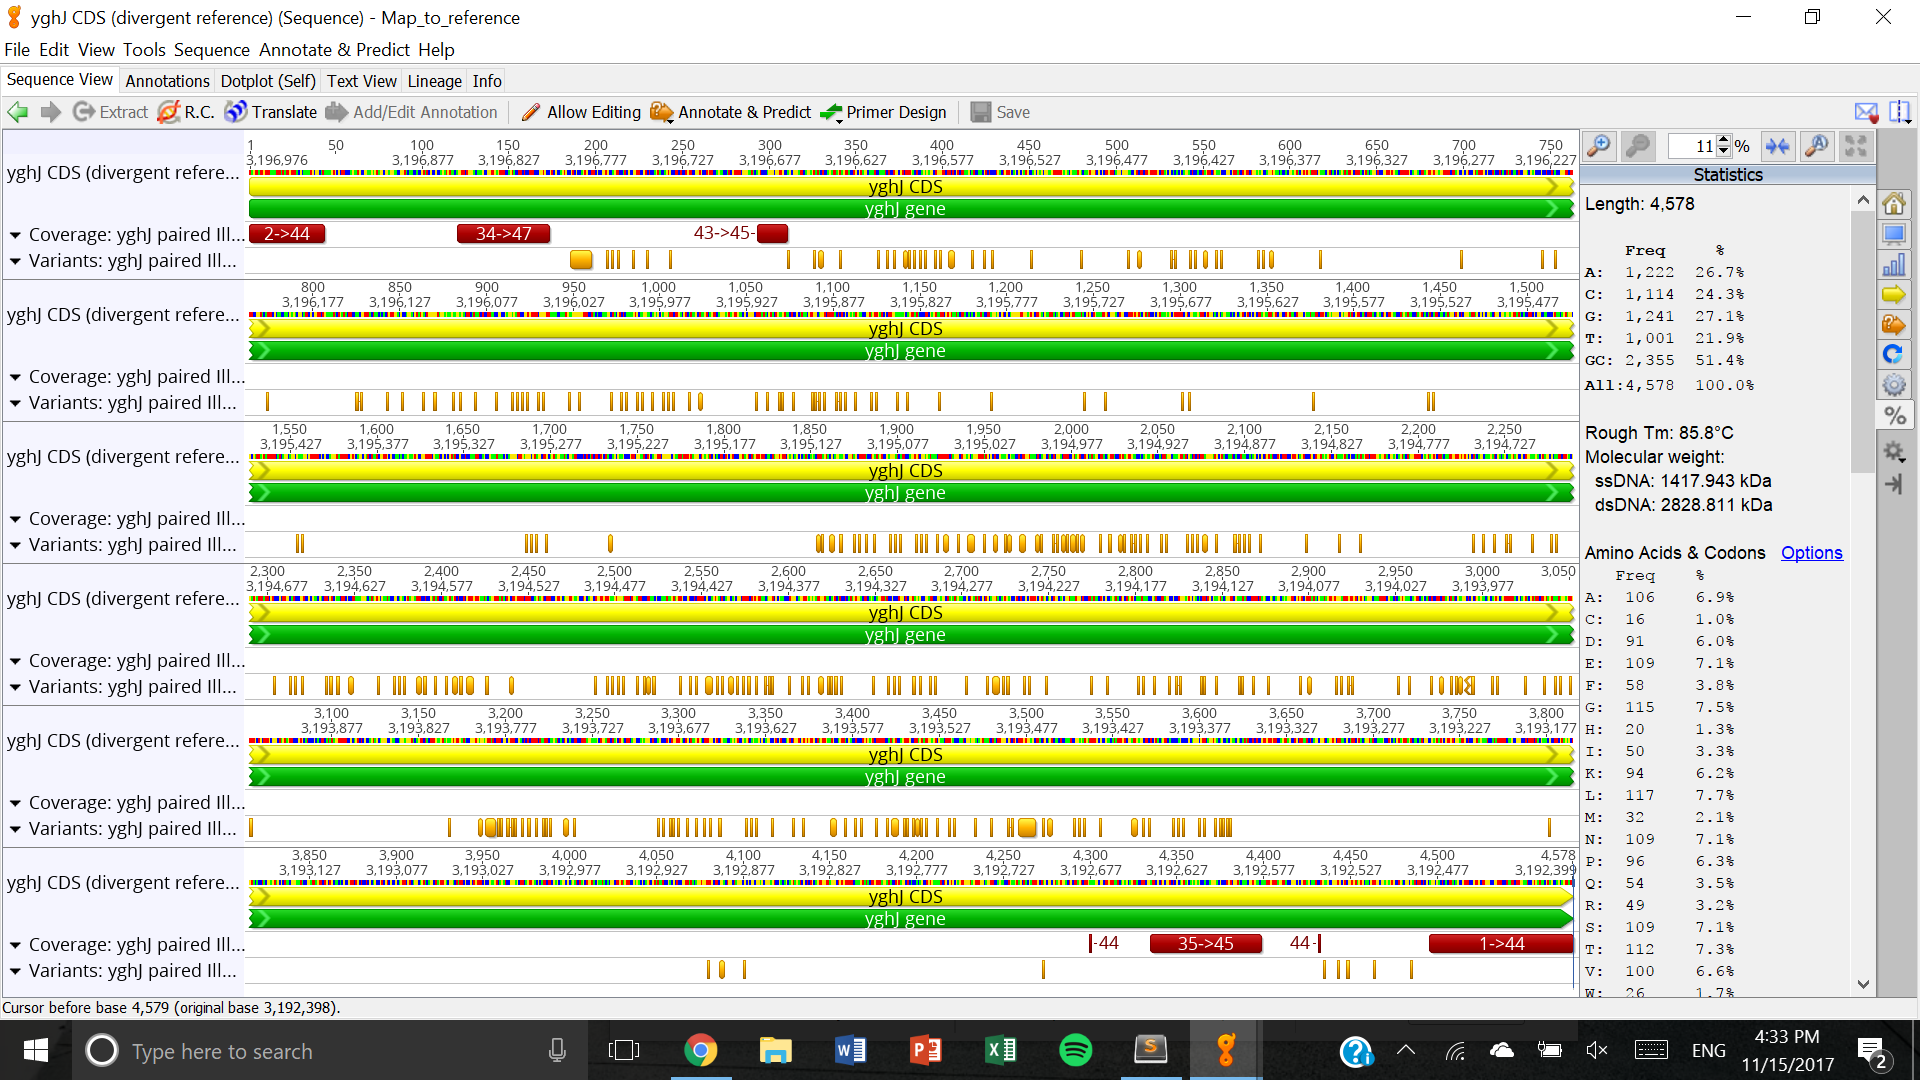
Reference-based Assembly
- SRR10, SRR11, SRR18, SSR23, SSR25
- Paired-end because it makes direct alignments of the reads and trims the reads while using a reference.
- It took very little time.
- Ave. 98.1, min. 1, max. 139, the ends have the lowest coverage because they are the variable at the ends with various base pair lengths.
- 4035 G –> K, 3961 A –> W, 3972 T –>D, 3803 T–>W, this tells us that there are polymorphisms at this location.
- 3798-3807, they show little significance and hence, exclude them
- 207 G to C (transversion – protein substitution), 222 G to A (transition), 230 C to T (transition), 311 T to A (transversion – protein substitution)
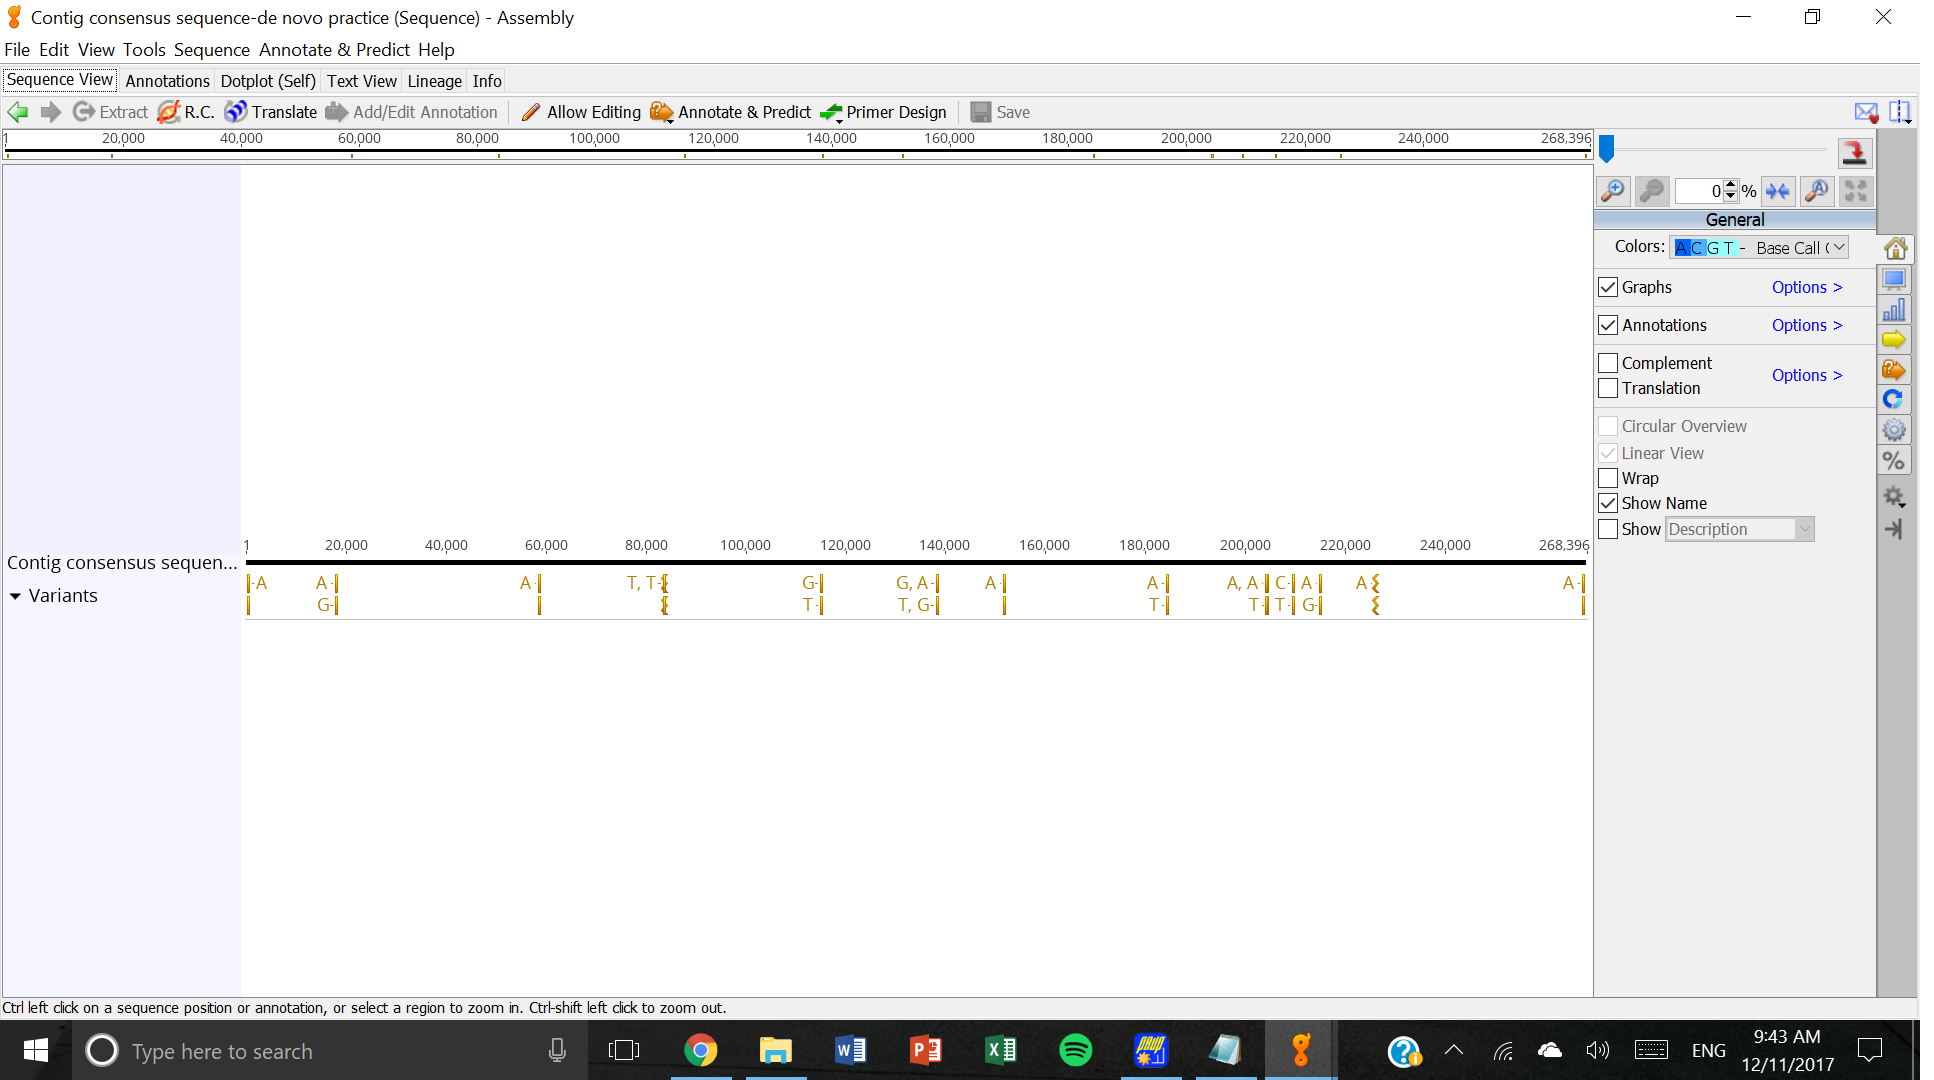
De Novo
- 25172 reads total, 4 contigs, 17994 in largest, 511 minimum length, 133444 mean, 192891 NC50 score
- 27.7 secons, contig 1 = highest coverage, contig 3 = lowest coverage
- 92077-92267
- 30.75 seconds
- 340, 18033, 58852

The final aspect of this lab was using binary code to create a Nexus file of the data results from running gel electrophoresis of the lupin DNA samples. A file was created based on a template provided by Prof. Paul. My data was substituted into the file in which the plant sample names were put into the file with respect to the presence of bands based on the gel results. For each sample that displayed a band in a row, the sample would be marked as a ‘1’ for that row. If there was no band present, a ‘0’ would be assigned, or if the band was questionable if it was being displayed of not, a ‘?’ was assigned for that particular band. This was done for all of the samples between Omar and 17898 gel electrophoresis runs excluding some of the samples that displayed insufficient data.
Here is the Nexus file in the form of a .txt of the set up to be used in the next lab.
