Public Transportation Weighed Against Personal Vehicles
The United States is the third largest country by land mass, preceded only by countries with large areas of harsh tundra: Russia and Canada (Sauders, 2023). Public transportation is limited in many ports of these countries due to a variety of factors: lack of suitably sized quality roads, lack of funding, lack of patrons, lack of drivers, the topography of the land, and many more reasons. This leads to a heavy reliance on personal modes of transportation, mainly cars, for people to go about their daily commute. With a population of over double that of Russia’s and almost nine times more than Canada’s, the U.S.’ 340 million residents have a heavy reliance on cars (Sauders, 2023). According to the 2021 U.S. Census, there were about 280 million registered vehicles in the United States. The same survey asked how many cars each household owned: 37% owned two cars, 22% owned three cars, and only 8% owned no car (Brennan, 2023). The vast majority of these cars use gas rather than electric batteries, therefore they produce a lot of carbon dioxide emissions, exacerbating the greenhouse effect.
The United States is the largest carbon dioxide producer due to transportation, emitting 1.75 billion metric tons of carbon dioxide (CO2) in 2022. The U.S. produces more than the following four countries, China, India, Russia, and Brazil, combined (statista, 2023). This means that in 2022, the average person in America emitted 4,486 kg of CO2. In the year prior, the EPA produced a report that proved transportation was the highest cause of greenhouse gas emissions in the country at 27%. Only 18% of transportation based emissions come from sources other than cars, such as flights, ships, and railways. The remaining 82% comes from personal vehicles, with the largest portion from lightweight trucks, minivans, sport vehicles, and pick-up trucks. This data paints a crystal clear image: the culture and infrastructure supporting individual transportation in this country creates an excessive and harmful amount of carbon dioxide emissions. One critical response to combating the amount of emissions caused by the transportation system is to create a public transit system. The bus system is one of the most common and feasible ways to form public transit because it uses pre-existing infrastructure. The Department of Transportation gathered that bus transit produces 33% less CO2 than private vehicles in their 2010 report, “Public Transportation’s Role in Responding to Climate Change.” Instituting and supporting public transit is instrumental in combating the greenhouse effect.
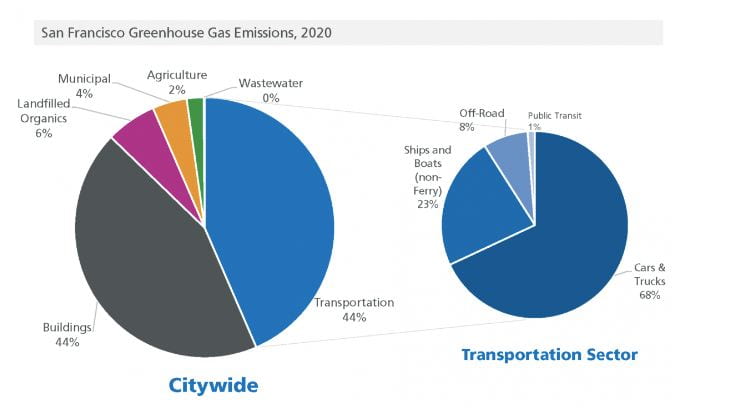
Figure 1. Greenhouse Gas Emissions in San Francisco, 2020. Transportation accounted for 44% of emissions.
In 2015, all public transit systems in the Bay Area, including Muni, Caltrain, BART, and SF Bay Ferry, emitted less than nine percent of the total transportation emissions from that year. The remaining emissions all came from cars and trucks (SFMTA, 2017). Muni, San Francisco’s bus system, supports people on their everyday journeys. Almost a quarter of the population took the Muni system in 2021 (sftransitriders, 2023), and 11% of the population rode it every day (Moran, 2022). The Muni network sprawls over large areas of the city, running all day and night, and connects to various other public transportation systems in the city. The San Francisco Municipal Transportation Agency (SFMTA) has a clear focus on combating climate change, stating that “Muni projects support the largest fleet of zero-emission buses in the US and the cleanest fleet in California” (SFMTA, 2023). SFMTA also operates the Muni Metro light rail and streetcar networks, which runs on emissions free hydroelectric power. For nearly 85 years, the electric buses, light rail, and streetcars in the city have all been powered by hydroelectric energy from the Hetch Hetchy dam, which produces no greenhouse gasses (SFMTA, 2021). The city’s transit department is dedicated to providing as much transportation as possible with the fewest emissions possible. SFMTA follows through on this mission, supporting a large number of the population while only producing 1% of the CO2 emissions of the city’s total transportation based greenhouse gas emissions in 2020 (SFMTA, 2023), shown in Figure 1. Zooming out even further, public transit accounted for less than 0.5% of the city’s total greenhouse gas emissions. With this information, it is clear that a great way to combat the overall emissions from transportation in the country is for local cities to focus on instituting public transit systems.
San Francisco, a large metropolitan area with a population close to a million, is a city with a thriving public transit system that helps support the initiative to reduce greenhouse gasses. In addition to sheer population, the city is also very densely populated, second in the US only to New York City (Worldpopulationreview, 2023). The city is aided by the fact that its transit systems serve a high population within relatively short distances. Cities spread out over larger areas face challenges in being able to adequately ensure the city is well served, such as expending more energy to travel greater distances and creating travel paths that reach the dispersed population. Therefore, it is important to acknowledge this advantage that San Francisco has in terms of building an efficient transit system.
Post-pandemic, Muni buses and trains are not always at full capacity; sometimes they run near empty with very few passengers. A great way to support the city’s mission in reducing emissions is to use public transportation more regularly. The more people rely on public transportation, the fewer personal vehicles remain on the road, transforming a person’s transportation emissions into something far less to what it was initially. Furthermore, greater demand and support for public transit will help transit systems grow in order to transport even more people throughout the city.
Bibliography
Belov, Charles. “Climate Action at the SFMTA.” San Francisco Municipal Transportation Agency, 29 Sept. 2023, www.sfmta.com/sustainability-and-climate-action.
Brennan, Rachel. “Car Ownership Statistics in the United States.” Policygenius, 11 Jan. 2023, www.policygenius.com/auto-insurance/car-ownership-statistics-in-the-united-states/.
C2ES. “U.S. Emissions.” Center for Climate and Energy Solutions, 1 Dec. 2022, www.c2es.org/content/u-s-emissions/.
Chun, Stephen. “How People Traveled through San Francisco in 2021.” San Francisco Municipal Transportation Agency, 19 Apr. 2022, www.sfmta.com/blog/how-people-traveled-through-san-francisco-2021-0.
EPA. Sources of Greenhouse Gas Emissions | US EPA, 5 Oct. 2023, www.epa.gov/ghgemissions/sources-greenhouse-gas-emissions.
“Putting Riders First.” San Francisco Transit Riders, 2023, sftransitriders.org/#:~:text=Close%20to%20250%2C000%20people%20rely,our%20climate%20and%20sustainability%20goals.
Sauders, Toby. “Top 10 Largest Countries in the World 2023.” BBC Science Focus, 18 June 2023, www.sciencefocus.com/planet-earth/largest-countries-in-the-world.
Stefiuk, Emily. “Taking Climate Action to the Streets.” San Francisco Municipal Transportation Agency, 18 Mar. 2022, www.sfmta.com/about-us/sustainability-and-climate-action/building-sustainable-streets.
Tiseo, Ian. “Global Transport GHG Emissions by Country 2022.” Statista, 6 Oct. 2023, www.statista.com/statistics/1084166/ghg-emissions-transportation-sector-globally-by-country/#:~:text=The%20United%20States%20is%20the,India%2C%20Russia%2C%20and%20Brazil.
US Cities Population Density 2023. US cities by population density 2023. (2023). https://worldpopulationreview.com/us-city-rankings/us-cities-by-population-density
U.S. Department of Transportation. “Public Transportation’s Role in Responding to Climate Change.” Federal Transit Administration, Jan. 2010, www.transit.dot.gov/sites/fta.dot.gov/files/docs/PublicTransportationsRoleInRespondingToClimateChange2010.pdf.
Wald, T. (2023, May 10). Historic Presidential Commission Car Rehabilitations and upgrades. SFMTA. https://www.sfmta.com/projects/historic-presidential-commission-car-rehabilitations-and-upgrades


