Lab 12 Entry
11/14/18 Wednesday ISSR Analysis and Geneious.
I added loading dye into my PCR tubes, which were used from last lab. I added about 1 micro liters to each tubes (15 total).
Then including the solution inside the PCR tube, total of 5 micro liters, I added into the agarose gel that was given by the professor. The first and last wells were saved for ladder. I added 15 of Carter’s samples first and added my samples second. Kayla added her samples and added 3 of Peter’s samples. Last of Peter’s samples (12 samples) were loaded on the lowest line of 50 wells.
After every table loaded their samples onto the wells, professor Paul ran these gels at a low voltage (20 volts) for a long time ans see how things turn out. We didn’t get to see what happened.
Next, we moved on to Geneious. Our table had to do some work with JP5551 because our previous JP5334 was not very good. I did the same thing with JP5551 from the last lab and sent it to professor Paul so that every can download my nucleotide alignment and make concatenated alignment. I made a separate concatenated file and put JP 5334,5551,5525 and 5536 into the file. Then I choose all four documents and choose tools>Concatenate Sequences or Alignments and clicked ok. It created a concatenated alignments and I opened up to see if it looks correct. I have about 1500 nucleotides and I edited/cut the alignment 1029-1085 because it looked bad and thought that it can effect my phylogenetic tree. Next, I exported the file in phylip alignment type and saved it. Then I opened jmodeltest and loaded my alignment and compute likehood scores to calculate AIC and BIC. I got TPM G for both AIC and BIC so for my Bayesian analysis, I chose HKY85, gamma and TG0248. Then ran the analysis for 3,000,000 chain length, 500 subsampling frequency and 300,000 burn in length values. It took about 2 hours and 30 minutes and gave me this result.
Parameter estimates look pretty good and the trace graph has that caterpillar thing shown on the graph.
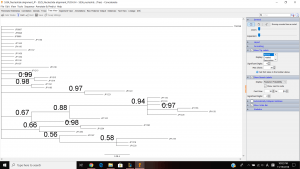
This is my tree view. My tree included multiple clades with the support value that is greater than 0.85. And I think that these individuals within in each clade are found in the same population.
I think that these concatenated EPIC markers provided enough resolution to distinguish populations phylogenetically because we, as a class, gather 4 different primers to make 4 different nucleotide alignment making it more precise and accurate than using just one primer. My analysis couple weeks ago was on JP 5334, which is the weird one, so I don’t know if it came out correctly, but it looks like I have a little more resolution than the single marker analysis on JP 5334 couple weeks ago.

