10/31/18 Lab
Analysis of EPIC Markers
After collecting the genetic sequences, we found out in the end that none of our genomes had amplified successfully during the PCR. Because of this we had to use prior collected data for our analysis of the EPIC markers. My EPIC marker was 5525 and I used 25 samples of Mimulus cardinalis and an out group TG248 (Mimulus lewisii).
I downloaded the sequences from Dr. Paul’s canvas under my assigned marker and imported them into Geneious. After assembling them using muscle and editing the sequences to line up, I identified an polymorphisms present. The columns that contained polymorphisms were 4-9, 10, 16, 21, 25, 27, 52, 66, 79, 82, 132, 181, 256, and 276. Using the polymorphisms and general scanning of different colored peaks, I identified any heterozygotes present. The columns I determined to have heterozygotes were 132, 108, 97, and 27. Two of these heterozygote columns were also polymorphisms (132 and 27). I recorded an polymorphisms with the IUPAC ambiguity codes.
After editing and recording my sequences, I continued on with the assembly of EPIC marker alignments. I individually assembled the forward and reverse reads and then built an alignment for each marker. After assembling, I created an alignment of all the assemblies, including my out group (which only had one sequence-not a forward and reverse). I renamed the consensus sequences to ensure the proper run of the Mrbayes tree.
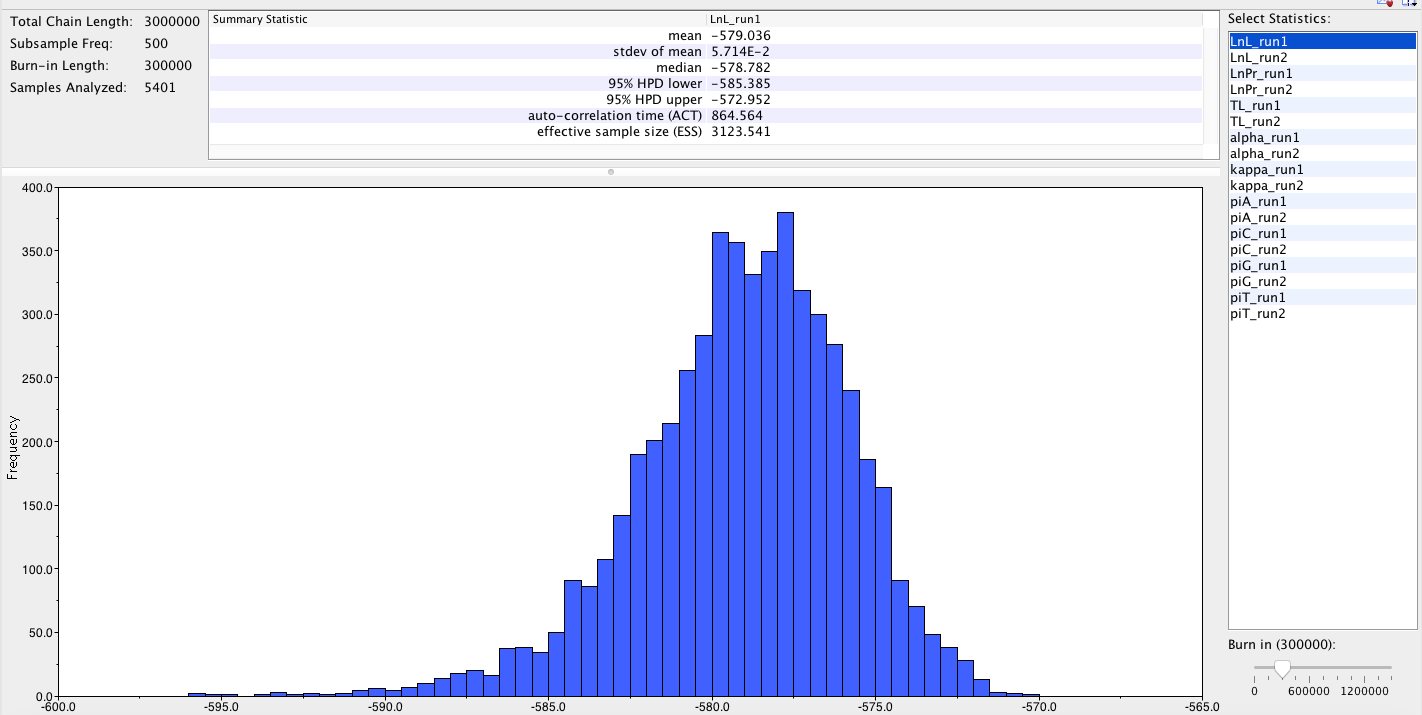
The Bayesian Tree strongly indicated clades that were extremely closely related which may indicate a geographic relationship between these species.


